mathblag

Musings on mathematics and teaching.

Month: September, 2012

Exploring patterns in Pascal’s triangle using Excel

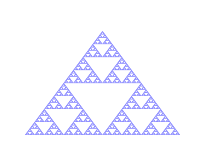
There are many interesting patterns hidden within Pascal’s triangle. For example, if we color every odd number, we obtain a pattern resembling the Sierpinski triangle. (Image credit: Wikimedia commons)

Sierpinski Triangle

Other patterns can be generated by coloring the numbers according to their remainder after dividing by 3, 4, 5, etc. Many of these patterns are explored in the book Visual Patterns in Pascal’s Triangle by Dale Seymour, and they are analyzed more deeply in a scholarly article by Andrew Granville with the improbable title Zaphod Beeblebrox’s Brain and the Fifty-ninth Row of Pascal’s Triangle.

It is a good activity for students to create these patterns themselves by calculating Pascal’s triangles and coloring the squares. But it is also possible to generate these patterns quickly in Excel using conditional formatting.

Pascal’s triangle can be generated quickly by copying a simple formula. Just enter the number 1 in D3, enter the formula =C3+D3 in D4, and then copy this formula to a square block of cells starting with D4 in the upper left corner.

Since the numbers grow very quickly, it is convenient to use the MOD function to reduce the numbers. I entered a modulus (initially 2) in B3, and changed the formula in D4 to =mod(C3+D3,$B$3). Finally, I created a conditional formatting rule to highlight all cells whose values are greater than 0.

Below is a screenshot of the result. Note that I have zoomed out as far as possible. My Excel spreadsheet is available here. (Warning: 2 MB)
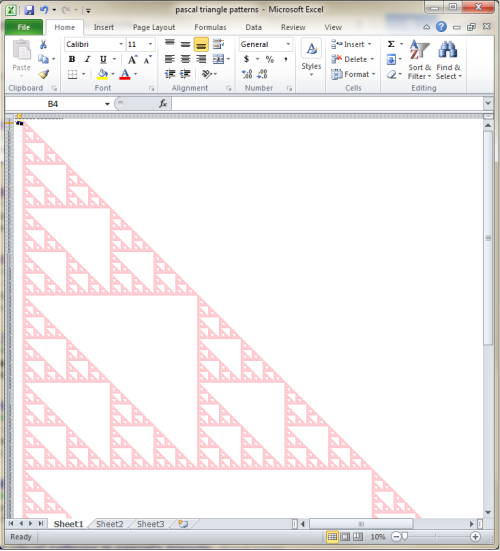
Sierpinski triangle in ExcelUpdate: Patrick Honner brought to my attention a nice video by Debra Borkovitz which demonstrates how to create these patterns in Excel.
 

Parabola through three points

Chris Harrow asked the following question on Twitter:

My interpretation is that we fix three non-collinear points in the plane, and we wish to describe all parabolas passing through these points. (There are infinitely many of these, since the axis of symmetry need not be vertical.)

For simplicity, I assumed that the three fixed points are (0,0), (1,0), and (0,1). This is reasonable because any three non-collinear points can be moved to (0,0), (1,0), and (0,1) by an affine transformation (linear transformation + translation), and because the image of a parabola under an affine transformation is again a parabola.

The general equation of a conic section is Ax^2 + Bxy + Cy^2 + Dx + Ey + F = 0, where A, B, and C are not all zero. A conic is a parabola (possibly degenerate) if and only if B^2 = 4AC. Since the parabola is assumed to contain (0,0), (1,0), and (0,1), we find that F = 0, A + D = 0, and C + E = 0. Furthermore, A cannot be zero, since we cannot draw a horizontal parabola through these points. So we may assume, after dividing through by A, that A = 1.

Combining these equations leaves us with a one-parameter family of parabolas:

x^2 + Bxy + \frac{B^2}{4} y^2 - x - \frac{B^2}{4} y = 0.

I created a GeoGebra animation to explore how changing the value of B affects the parabola. It would be interesting to explore the curves traced out by the vertex and the focus as B varies. Wolfram Alpha produced some formulas, but they are not easy to interpret.

Arranging numbers in a grid: Solution

In a previous post, I described the problem of counting arrangements of the numbers 1 through 16 in a 4×4 grid so that squares with consecutive numbers never touch, even at a corner.

This is a difficult problem, because the set of solutions has little obvious structure. It seems unlikely that a simple formula would exist. On the other hand, naive brute-force is not effective, because there are 16! = 20,922,789,888,000 permutations. Even using a computer, this is too many possibilities to check.

The Monte Carlo method is an effective way to estimate the number of solutions. We simply generate a large number of random arrangements, and count the arrangements which have no consecutive numbers touching.  When I ran this simulation with one million trials, there were 838 successes; so the estimated total number of solutions is 16! * 838 * 10^-6, which is approximately 17.5 billion.

But I wanted to find the exact number of solutions. After several failed attempts, I settled on a divide-and-conquer algorithm.

For each partition {A, B} of the set {1,2,…,16} into two subsets of equal size, find all valid arrangements of A into the top half of the grid, and find all arrangements of B into the bottom half of the grid. Then we add up the pairs of arrangements that are compatible. An important fact is that compatibility is determined by the two middle rows, so we can “lump” some of the 4×2 arrangements together.

The final answer is 17,464,199,440, which is suspiciously close to the Monte Carlo estimate (other runs were not as close). My Python code is available here.