Exploring patterns in Pascal’s triangle using Excel
by David Radcliffe
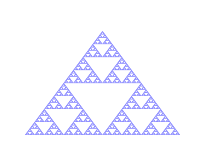
There are many interesting patterns hidden within Pascal’s triangle. For example, if we color every odd number, we obtain a pattern resembling the Sierpinski triangle. (Image credit: Wikimedia commons)
Other patterns can be generated by coloring the numbers according to their remainder after dividing by 3, 4, 5, etc. Many of these patterns are explored in the book Visual Patterns in Pascal’s Triangle by Dale Seymour, and they are analyzed more deeply in a scholarly article by Andrew Granville with the improbable title Zaphod Beeblebrox’s Brain and the Fifty-ninth Row of Pascal’s Triangle.
It is a good activity for students to create these patterns themselves by calculating Pascal’s triangles and coloring the squares. But it is also possible to generate these patterns quickly in Excel using conditional formatting.
Pascal’s triangle can be generated quickly by copying a simple formula. Just enter the number 1 in D3, enter the formula =C3+D3 in D4, and then copy this formula to a square block of cells starting with D4 in the upper left corner.
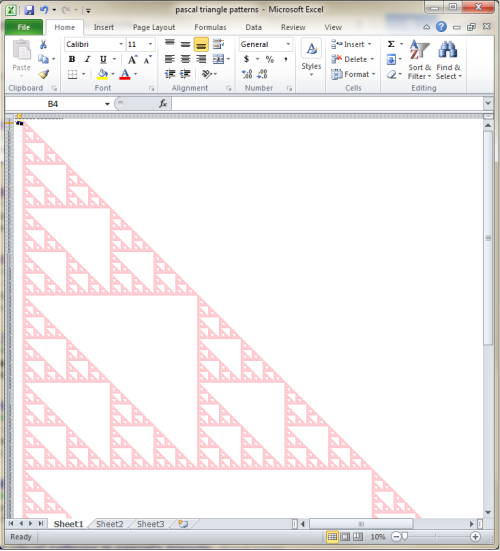
Since the numbers grow very quickly, it is convenient to use the MOD function to reduce the numbers. I entered a modulus (initially 2) in B3, and changed the formula in D4 to =mod(C3+D3,$B$3). Finally, I created a conditional formatting rule to highlight all cells whose values are greater than 0.
Below is a screenshot of the result. Note that I have zoomed out as far as possible. My Excel spreadsheet is available here. (Warning: 2 MB)
 Update: Patrick Honner brought to my attention a nice video by Debra Borkovitz which demonstrates how to create these patterns in Excel.

How can we create the Sierpinki square in excel?